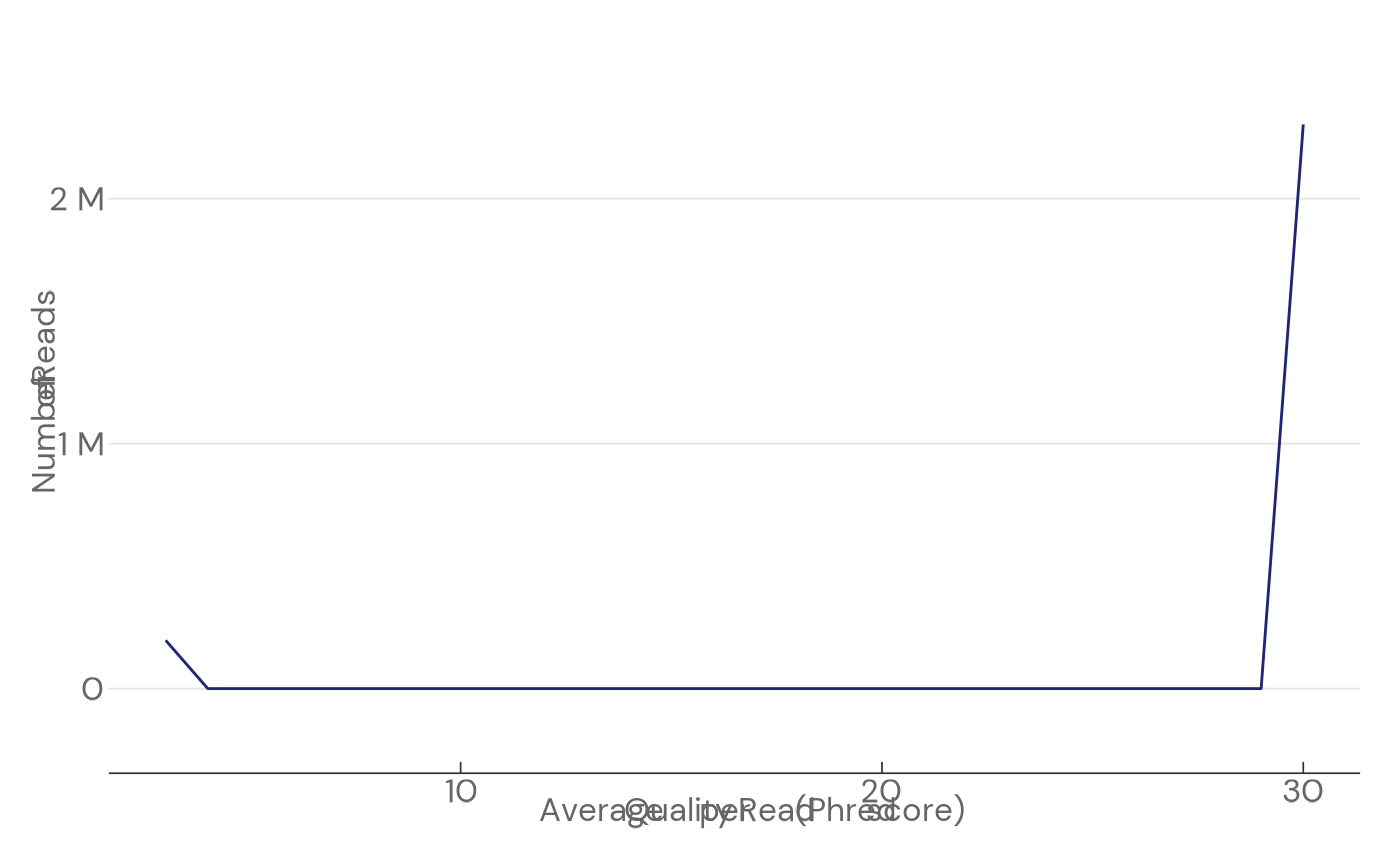
FastQC-viz: Plot Per Sequence Quality Scores
Source:R/plot_per_sequence_quality_scores.R
plot_per_sequence_quality_scores.RdCreate plot for "Per Sequence Quality Scores"
Arguments
- fastqc_data
parse_fastqc()output- output_path
character, path to save the .png file
Examples
theme_set_fastqcviz()
fastqc_data <- parse_fastqc(system.file("extdata", "SRR622457_2_fastqc.txt", package = "fastqcviz"))
plot_per_sequence_quality_scores(fastqc_data)