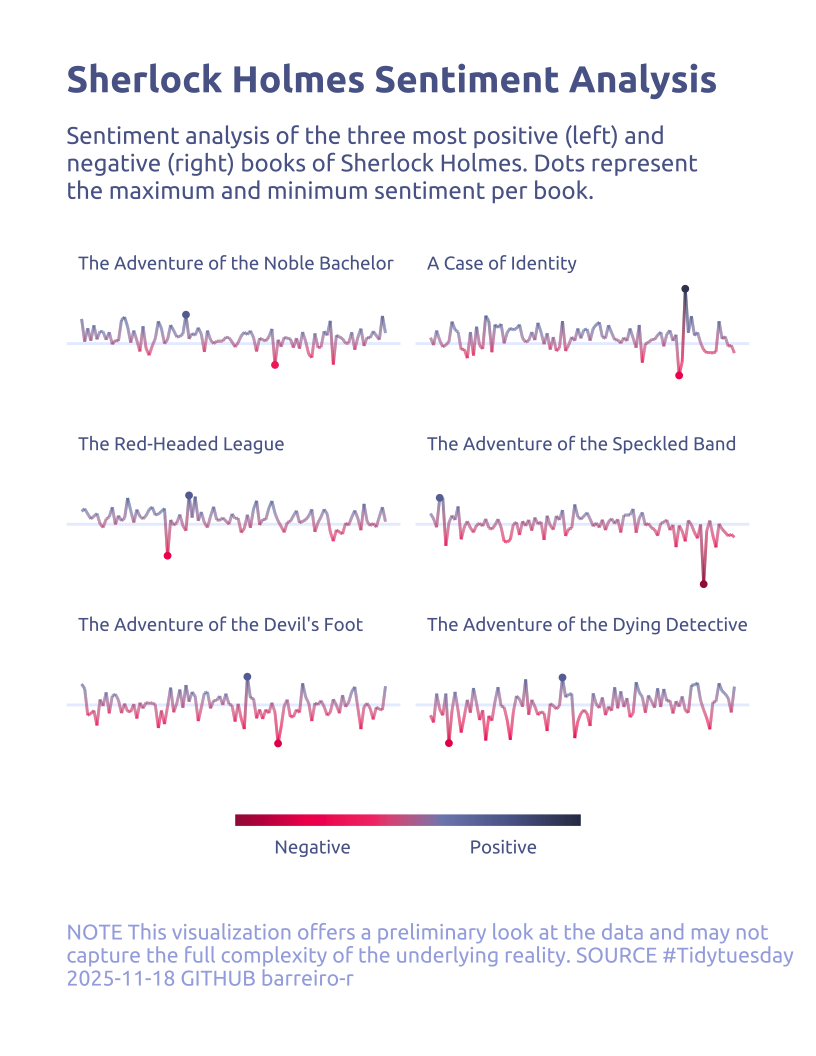
TidyTuesday by Rodrigo
  • barreiro-r/tidytuesday

On this page

  • Gallery
Categories
All (18)
bars (7)
circular (4)
composition (2)
geospatial (2)
map (2)
maps (1)
network (1)
python (2)
radar (1)
scatter (1)
slope (1)
subplot (2)
subway (1)
timeseries (7)
waterfall (1)

Tidytuesday by Rodrigo Barreiro

Hey there, and welcome to my TidyTuesday gallery!  👋

If you’re not familiar, #TidyTuesday is this awesome weekly data challenge run by the R for Data Science online community. Every week, they release a brand new dataset, and I jump at the chance to practice my data wrangling and visualization skills in R (and Python).

For each entry, you’ll find my code, the visuals I came up with.

I love seeing what stories the numbers can tell and I hope you enjoy it too!

— Rodrigo Barreiro

Gallery

geospatial
maps
Aug 19, 2025

bars
composition
timeseries
Aug 12, 2025

bars
slope
composition
Aug 5, 2025

network
Jul 29, 2025

timeseries
subway
Jul 22, 2025

waterfall
timeseries
bars
Jul 15, 2025

circular
scatter
Jul 8, 2025

timeseries
Jul 1, 2025

bars
circular
map
subplot
Jun 24, 2025

bars
circular
Jun 17, 2025

timeseries
subplot
Jun 10, 2025

bars
Jun 3, 2025

radar
May 27, 2025

timeseries
May 23, 2025

geospatial
May 13, 2025

map
circular
Apr 11, 2025

python
timeseries
Mar 4, 2025

python
bars
Feb 18, 2025
No matching items
 

Made with Quarto by Rodrigo Barreiro